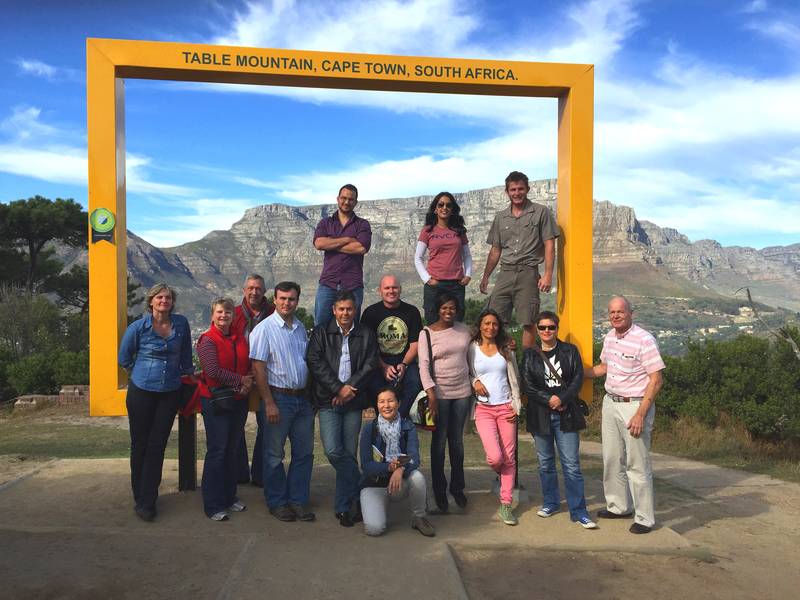
Tourist Guide Institute attended a workshop with the City of Cape Town’s Local Government Services on 10 June 2015. These are some of the interesting facts and statistics given by the different speakers and my thoughts and questions that arise from these results.
The City with Cape Town Tourism has gathered this data over the last three years using National Data, surveys done in Cape Town with tourists and establishments such as the hospitality industry and tour operators.
National Data for 2013
Average length of stay in SA by foreign tourists 9 nights
Average length of stay in SA by domestic tourists 7,5 nights
Total number of bed nights sold by foreign tourists 13 392 566
Total number of bed nights sold by domestic tourists 5 247 426
Average spent per day by foreign tourists R877
Average spent per day by domestic tourists R355
Foreign Direct Spending R74 200 000 000
Total spent by domestic tourists in SA R22 500 000 000
Total Direct Tourism Spend in Cape Town R14 300 000 000
Total Number of Tourists in 2013
Nationally Foreign tourists 9 616 964
Western Cape Foreign Tourists 1 569 195
Cape Town Foreign Tourists 1 487 597
My question is : why are we only getting about 15,5% of the tourists to Cape Town? What can we do to offer more to draw more tourists to the Mother City?
Monetary Value of Tourism to Cape Town
There are 4,8% of people in Cape Town that are employed in the Tourism Industry directly whereas 4,6% nationally are directly employed in the Tourism Industry. Tourism nationally adds 3,1% to South Africa’s economy and 2,88% to Cape Town’s economy.
Total number of people employed in Tourism is Cape Town 2013/2014
Permanent 37 551
Temporary 15 130
I’m sure these figures are very conservative as data is difficult to obtain as many establishments don’t submit their annual reports and there are so many people who are employed indirectly eg a hotel buys food from supermarkets, they use maintenance companies for repairs and construction, laundry facilities, newspapers and printers etc. If one adds it all up, it is estimated that for every 1 tourist, 8 people are employed either directly or indirectly.
Annual results for 2014
The Big 6 Tourism Sites in Cape Town 2014
The following figures are gathered on a monthly, seasonal and annual basis. They indicate both foreign and domestic tourism.
Number of visitors:
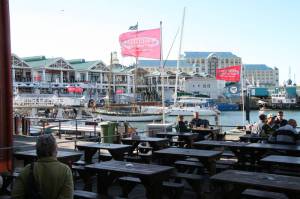
V&A Waterfront 24 000 000 (this included the in and out of local shoppers)
Table Mountain 948 756
Cape Point 920 000
Kirstenbosch 338 193
Robben Island 338 192
Groot Constantia about the same as Robben Island
These figures show what most tourists like to see in Cape Town and it is important to include them in itineraries, but there is so much more that a tour operator and tourist guide can introduce tourists to that are not mentioned above eg Duiker Island, Boulders Beach, Townships, Mountain Hikes, Bokaap and what about little gems such as some of our museum, art galleries and food markets.
Arrivals at CT International Airport:
4 303 435 which is a 3,39% growth
Accommodation In Cape Town
Accommodation in Cape Town had 66% occupancy in 2014 with R1 284 as the average room rate.
Tour operators are often including less nights in Cape Town in their national tours as they say it is too expensive compared to the rest of South Africa. It is important for our establishments to be competitive. Tourists are fickle not loyal, they’ll go where there is good value for their money.
Occupancy of different areas in Cape Town:
1. City Centre
2. Blaauwberg
3. Helderberg
4. South Peninsula
Average Room Rate for the different areas:
1. City Centre
2. South Peninsula
3. Helderberg
4. Blaauwberg
Tourists Profile
20% Germany
17% South Africa
11% UK
6% USA and France
5% Netherlands and Switzerland
3% Canada and Italy
I am not sure where the Asian market fits in or maybe I didn’t see the percentages when displayed at the workshop. All I know is that wherever I go on tour in Cape Town, I see many Asian tourists.
Main purpose of visiting Cape Town
86% holiday
10% business
2% education
There is talk to market Cape Town more in winter especially, for business tourism as the business tourist doesn’t need sunshine and beaches. This means that we can get more tourists here even if it is cold and raining.
Average Tour Size
53% 2 people
25% 1 person
14% 3 – 4 people
Average length of stay in Cape Town
5 – 7 nights
Type of accommodation used by tourists
33% self catering
25% guest houses
22% B & B
18% hotels
Transport in Cape Town for tourists
26% rented cars
25% tour buses
What draws tourists to Cape Town
62% are drawn to the natural beauty and great outdoors
history and culture
food and wine
wonderful beaches
The Tourist Train with Metrorail
Metrorail offers a tourist train and the top destinations are:
Simonstown – for submarine tours, whale cruises, shark cage diving, penguins
Stellenbosch – wine tasting
Khayelitsha – township tours
This is something I’ve never done nor included on an itinerary. I think I’ll take my family one weekend to experience it first and then see whether I’d fit this into an itinerary. It could be a different experience for tourists and as a tourist guide and tour operator, I am always looking for something different to add into a tour that’ll make my tours more competitive in today’s market.
I’d love to hear your comments and thoughts on any of the above.
Please leave them in the spaces below.
Written by Julie Womack June 2015


Would love to see refreshed/latest data in this regard. Cape Town and environs
Hello
Can you please advise me how many international tourists visit the Penguins at Boulders per year ? I’m doing a feasibility study around service delivery in the area.
thank you
Good day, can you assist me with the number of visitors to the Simons Town area 2015-2016. I am wanting to convert a home into holiday accommodation and am doing a feasibility study to understand the market.
Thanking you in advance.
Lise
Hi Nicole
See the link for updates http://www.capetown.travel/wp-content/uploads/2017/09/CTT-Research-Report-July-2017_Classic.pdf
Thanks for the article. Do you have updated figures?
Good Morning,
Do you have those statistics for 2015?
Many Many Thanks,
Anouck
Love reading your post here. By the way this is Muhammad and m from Pakistan. I would love to become a tour guide but right now i am working in durban. Can u help me, if there is any institute here in durban or will it be better to go cape town and take a course. By the way i love cape town.
And most importantly i am more wondering about getting a job as a tour guide.
I will appreciate any kind of help.
Thanks